
Diagnosis of temporomandibular joint osteoarthritis using a minimally invasive protocol
Temporomandibular joint osteoarthritis (TMJOA) is an arthritic condition on the low end of the inflammatory spectrum, and it has been linked to inflammatory mediators, which deteriorate anatomic structures within the joint. The aim of this study was to determine whether using a state-of-the-art machine-learning technique to evaluate condylar morphology could be combined with variations in protein biomarkers obtained using a minimally invasive approach and clinical symptoms in the diagnosis of TMJOA. Results of this study were published in the October issue of Journal of Dental Research.
Seventeen patients with TMJOA and a less than 10-year history of symptoms and 17 age- and sex-matched control participants comprised the study population. Clinicians applied the diagnostic criteria for temporomandibular disorders (DC/TMD) when diagnosing TMJOA clinically and radiographically. All study participants received a clinical examination of their TMJs, following the standardized DC/TMD clinical examination and questionnaire forms. Custom human Quantibody protein microarrays (RayBiotech, Peachtree Corners, GA) quantitatively analyzed saliva and serum samples collected from each study participant for 17 biomarkers previously shown to be expressed in synovial fluid and serum of patients with TMJOA.
All study participants underwent a high-resolution cone-beam computed tomographic scan (Morita 3D Accuitomo, J. Morita) with the region of interest encompassing the inferior border of the squamous portion of the temporal bone to the condylar neck bilaterally. Three-dimensional (3D) surface meshes with 1,002 correspondent points were reconstructed of each condyle, and a validated regional superimposition technique was used for across-participant comparisons. Patient data were stored in a secure, web-based data storage, computation, and integration system. Condylar surface meshes from 259 condyles (154 patients with TMJOA, 105 control participants ) collected from previous studies were used to train the neural network (NN) to distinguish different degrees of shape deformation of TMJOA condyles. Two expert clinicians undertook consensus visualization and interpretation of 3D condylar surface morphology and developed a classification schema of 6 groups. Group 0 consisted of normal condyles, while groups 1 through 5 exhibited varying degrees of condylar degeneration, with group 5 being the most severe. The condyles from the 34 study participants were then used to test the NN by classifying the stage of TMJOA in the testing data sets and comparing it with the clinical experts’ classification twice. Statistical analysis was performed using SPSS software (Version 24.0, SPSS). Multivariate functional shape data analysis tested the integrating information of 3D mesh coordinates, clinical markers and biological markers. An integrative statistical model of clinical, biological, and imaging markers was developed.
Levels of salivary biomarkers matrix metalloproteinase (MMP)-3, vascular endothelial (VE)-cadherin, 6Ckine, and plasminogen activator inhibitor (PAI)-1 were significantly associated with anatomic variability of the posterior surface of the condyle. Serum VE-cadherin and vascular endothelial growth factor (VEGF) demonstrated significant anatomic variability of the anterior surface of the condyle, while MMP-3 and C-X-C motif chemokine ligand 16 (CXCL 16) showed statistically significant associations with anatomic variability on the anterior surface, lateral pole, and superior-posterior condylar surface. The most significant associations of clinical markers with anatomic variability at the medial and lateral poles were the range of mouth opening variables. Repeated clinician consensus classifications showed 97.8% agreement on level of degeneration within 1 group difference for the training data and 97.1% for the testing data. Predictive analysis of NN staging of TMJOA compared with repeated clinicians’ consensus had 73.5% and 91.2% degrees of conformity.
Alterations in serum protein levels have been shown years before radiographic signs of OA appear. Moreover, the pain thresholds of people, variations in patient symptomatology, limitations in clinicians’ visual perception, and subjectivity of radiographic interpretation can lead to disagreement among clinicians and result in a misdiagnosis or delayed diagnosis for patients. The authors conclude that this study showed an association among salivary and serum biomarkers, clinical indicators, and condylar morphologic features as detected by a NN may lead to a diagnosis of TMJOA in a minimally invasive manner. They propose that a more accurate NN may be trained as larger standardized omics data sets become available and ultimately enable clinicians to guide individualized disease-management strategies for patients with TMJOA.
Read the original article here or contact the ADA Library & Archives for further assistance.
Advertisement

Delayed third-molar development in jaws with short retromolar space may predict impaction
Although short retromolar space has been established as a risk factor for third-molar (M3) impaction in young adults, space alone is not the sole causative factor leading to this outcome. The authors investigated whether delayed M3 development, either alone or in combination with short joint space, might suggest future M3 impaction from a young age. The results of this study were published in the October issue of Archives of Oral Biology.
The authors conducted a retrospective analysis of cone-beam computed tomographic (CBCT) scans obtained from children aged 8 through 13 years from western Canada for various diagnostic purposes or surgical and orthodontic planning. Additional inclusion criteria were no congenital malformations, pathoses, or a history of trauma; no evidence of prior extraction in the quadrant investigated; only quadrants with fully erupted first molars (M1); absence of severe malocclusion; and acceptable CBCT quality. Final sample size was 689 M3 regions (348 maxillary, 341 mandibular). Demerijian’s 9 distinct stages of M3 development from crypt formation through the 8 progressive stages of crown and root mineralization were used, and M3 development was treated as a continuous variable in the analysis.
All CBCT scans were obtained using an i-CAT (Imaging Sciences International) imaging unit and measured using Xoran i-CAT software (Imaging Sciences International). Linear measurements were obtained from the distal-most point of the M1 crown to either the posterior-most point of the maxillary tuberosity or the anterior-most point of the mandibular ascending ramus. This retro M1 space in millimeters was referred to as spm1. The developing second molar (M2) crown was measured at its greatest mesiodistal dimension to determine whether the available spm1 exceeded the M2 crown diameter. If spm1 was greater than or equal to M2 crown diameter, retro M2 space was deemed available. If spm1 was less than M2 crown diameter, retro M2 space was not available. A multiple linear mixed-effects model was calculated to predict stage of M3 development based on length of spm1 after controlling for the influence of age, sex, jaw, and side of jaw. Statistical tests were conducted using IBM SPSS (Premium GradPack, Version 25, 64-bits) for Mac with α level set at 0.05.
There was a significant and positive association between stage of M3 development (m3stg) and spm1, either alone (t, 6.536; P = .001) or along with age (t, 5.208; P = .001) and jaw (t, –3.089, P = .001). Both age and spm1 were significant and similarly strong predictors of M3 development (m3dev), an effect most pronounced in the maxilla. Absence of M3dev was more common in participants with the lowest spm1 within each age group and, again, was most pronounced in the maxilla.
In both jaws, presence of M3 and advanced m3stg were correlated. If space availability was below a minimum age-specific threshold, no development of M3 was visualized. This indicates that 2 contemporaneous developmental processes (m3dev and m3stg) are at least partially associated with availability of retromolar space. However, availability of space is not solely age-dependent, which suggests that individual patient variations can influence m3dev. Initiation of m3dev was not seen before M2 crown formation was complete, indicating that progressive development of the dentition follows a cadence. Although m3dev would not occur if spm1 fell below a certain threshold at younger ages, the minimum required space decreased with every additional year of age, which suggests that other, stronger somatic, genetic, or environmental forces are at work in these early ages.
The authors conclude that delayed m3dev and short retromolar space are 2 coexistent risk factors that are at play from early childhood, which can help predict M3 eruption or impaction. The authors encourage further investigation into environmental factors, such as variability in diet, which may also influence M3 developmental status.
Read the original article here or contact the ADA Library & Archives for further assistance.
Advertisement
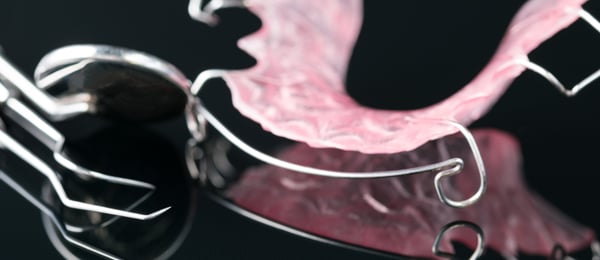
Functional orthodontic appliances lead to neuromuscular changes and brain cortex activity
Removable functional orthodontic appliances have long been used to treat Class II malocclusions. Such appliances induce dental and skeletal corrections in addition to enhancing neuromuscular activity to train the patient in a new mode of functioning. The aim of this study was to evaluate cephalometric outcomes produced by wearing a functional appliance and to determine effects of the appliance on masticatory muscles, temporomandibular joint, and cerebral cortex in young patients with Class II malocclusion using magnetic resonance imaging (MRI) to determine whether full-time (FT) or part-time (PT) wear schedules produced different outcomes. The results of this study were published in the July issue of Dentomaxillofacial Radiology.
The study population was comprised of 16 patients (8 male, 8 female) with Class II division 1 malocclusion. Inclusion criteria consisted of having skeletal and dental Class II malocclusion due to mandibular retrusion; having an unesthetic soft-tissue profile; being in or near the period of maximum pubertal growth as revealed by hand-wrist radiographs; not requiring gradual mandibular activation for profile correction (< 6-7 millimeters); and having late mixed or permanent dentition.
Cephalometric and hand-wrist radiographs as well as anatomic and functional MRI (fMRI) studies were obtained before (T0) and after treatment (T1), with the appliance at a mean of 14.8 months. Owing to fMRI acquisition inconsistencies early in the study, those images were not usable for the study group so a group of 10 control participants, also with Class II malocclusions, was recruited to provide the T0 fMRIs for comparison. All study patients received either a mono-block or twin-block appliance constructed to achieve a Class I relationship between the molars and the canines. Participants were randomly assigned into 2 groups; group 1 participants were to wear their appliances FT (except for meals), and group 2 participants were to wear their appliances PT, only while sleeping at night.
MRI was conducted using a Magnetom Trio 3.0T device (Siemens Medical, Germany) with a 32-channel head coil with anatomic structures visualized in T1-weighted high-resolution images. Evaluations were based on 2 parameters, signal intensity ratio and muscle activity. During the fMRI sessions, chewing and biting sessions alternated with sessions in which the participant was instructed to remain motionless. Images in Digital Imaging and Communications in Medicine (DICOM) 3.0 format were transferred to FreeSurfer (Version 6.0.0, MGH) software for morphometric analysis. Task-based fMRI images were analyzed in the FSL program (FMRIB Software Library Version 5.0, FMRIB Analysis Group). Statistical analyses were performed using the SPSS Statistics 20 (IBM) software package. A paired sample t test was used to ascertain whether differences between T0 and T1 images were statistically significant. A t test was used to compare T0 to T1 change in evaluated parameters between groups. Variance analysis was used for descriptive statistics and morphometric analyses of T1 between treatment groups and control group.
Cephalometric analysis demonstrated that the increase in the posteroinferior angle between anterior cranial base and nasion-point B line (SNB) angle was significant in Group 1 (P < .001). Increases in the distance between condylion and point A; total maxillary length (Co-A,) the distance between condylion and gnathion; total mandibular length (Co-Gn) and the distance between condylion and gonion; ramus length (Co-Go) lengths were significant in both groups. Groups 1 and 2 had a significant reduction in the angle between nasion-point A and nasion-point B lines (ANB) angles,1.17° and 1.35°, respectively (P < .05). MRI showed significant increases in both groups in signal intensity ratio posttreatment values of all masticatory muscles, retromeniscal pad, condyle and articular disk (P < .05). fMRI examination showed significant increases in blood oxygen level–dependent signals during both resting and task-based sequences in multiple areas of the brain in both groups (P < .05).
The rise in MRI signal intensity in the posterosuperior condyle indicates that functional appliances stimulate growth in the condyle superiorly and posteriorly. Volume increase and changes in signal intensity appreciated in masticatory muscles may be a result of increased perfusion and vascularization of the muscles, suggestive of muscular adaptation during long-term treatment. Functional appliances produce mandibular protrusion, and both pressure and pain occur when the mandible attempts retrusion. This creates a negative feedback loop in which the brain learns that the most comfortable mandibular position is protrusive.
In this study, both FT and PT wear of functional appliances brought about not only skeletal and dental changes, but also structural changes in masticatory muscles. The authors conclude that functional appliances should be considered exercise tools that produce neuromuscular change by facilitating muscular adaptation and activation of multiple brain regions.
Read the original article here or contact the ADA Library & Archives for further assistance.

Proximity of enlarged portion of third-molar root to mandibular canal increases likelihood of postextraction neuropathy
Damage to the inferior alveolar nerve (IAN) is a potential negative sequela of impacted mandibular third-molar (LM3) surgical exodontia. The relative position of the inferior alveolar canal (IAC) and roots change continuously during the process of extracting an impacted tooth. The authors considered that if the tooth is only dislocated along the long axis of the root during extraction, compression to the lateral wall of the socket and IAN injury may be prevented. The aim of this study was to assess the risk of developing IAN trauma by assessing the relationship between the root and the IAC in a plane that transects the long axis of the root so that all impacted teeth scheduled for extraction are dislocated along the long axis of the roots. The results of the study were published online July 28 in International Journal of Oral and Maxillofacial Surgery.
The study population included 166 patients (50 male, 116 female), and a total of 200 teeth were extracted. Inclusion criteria were patient age older than 20 years, impacted teeth having a mesioangular or horizontal impaction orientation, roots of teeth adjacent to IAC with no bone present between the roots and the IAC as visualized on preoperative cone-beam computed tomographic scan, and no presurgical paresthesia. On the cone-beam computed tomographic scan, the relative locations of the LM3 and the IAC, as well as the length of the cortical bone defect were evaluated. The horizontal and sagittal planes were adjusted to transect the long axis of the roots according to the relative position of LM3 and IAC in the coronal plane and set as reference planes. Two lines vertical to the long axis of the tooth (apical line and root enlargement line) were set as reference lines. Based on the relative position of the IAC and the reference lines, teeth were divided into 4 groups: apical region (AR), lateral region of the tapered root (LT), lateral region of the enlarged root (LE), and adjacent to the enlarged part (AE).
During surgery, a T-shaped coronectomy was performed. To control the direction of root dislocation, a narrow groove was prepared perpendicularly to the long axis of the root. An elevator was used to rotate the tooth according to the long axis of the root and the tooth dislocated from the socket. Neurosensory assessments were performed postoperatively and at 1, 7, 30, and 90 days postexodontia. Sensation was evaluated by both subjective and objective means.
Data analysis was performed using SPSS Statistics Version 19.0 (IBM). Postoperative neurosensory impairment of the IAN was the primary outcome. Risk factors for IAN injury was the secondary outcome. A χ2 test was used to analyze differences in postoperative IAN injury rates among groups.
Postoperative IAN injury occurred in 14 sites (7%), all diagnosed within 1 day after extraction. A total of 13 of 14 patients had recovered by 90 days, and full recovery in 1 patient in the AE group took 5 months. Significant differences were noted among groups for cortical defect length (P = .021), the distribution of lingually located roots (P = .012), and dumbbell-shaped IAC (P = 0.001). The greatest incidence of IAN injury occurred in the AE group (AE, 36%; LE, 8.6%; LT, 3.6%; AR 0%). Only the AE classification was a stand-alone risk factor for postextraction IAN injury.
Because the alveolar socket is semielliptical, dislocation along the long axis of the root should avoid compression of the IAN. In this study, both the long axis of the tooth and the IAC were transected by the reference plane, which was used to assess compression of the root to the IAC and the relative position of the root and IAC during LM3 dislocation. The authors conclude that a reference plane that transected the long axis of the tooth and the IAC was valuable for presurgical planning in the case of mesioangular and horizontal LM3 impactions.
Read the original article here or contact the ADA Library & Archives for further assistance.

Intraoral PSPs: One size does not fit all
How would capturing a larger diagnostic area impact your diagnostic capability? ScanX Intraoral Phosphor Plates (PSPs) enable you to capture 17-38% more diagnostic area than with other sensors. In certain cases, patient anatomy makes placement of sensors difficult resulting in the need for retakes. PSPs are 30 times thinner than sensors and are flexible and wireless for patient comfort, helping to eliminate the need for retakes. The ScanX digital radiography system is the perfect fit for any dental practice. If you have small children and young adults as part of your patient population, you know “One Size Does Not Fit All.”

ADA CE Online courses
 Need CE? ADA CE Online has hundreds of hours of CE that you can earn from the comfort of your own home. Too many to choose from? Take them all! Get unlimited access to the entire ADA CE online library, including JADA, for one year from purchase. Access anywhere, anytime. With new courses being added every month, you’ll never run out of education opportunities. Group subscriptions are also available, check it out now!

The consulting editor for JADA+ Specialty Scan — Radiology is Laurie C. Carter, DDS, Ph.D., past president, American Academy of Oral and Maxillofacial Radiology. |
|
