
Sex and age both influence the perception of smile esthetics before and after orthodontic treatment. Women are more critical than men of midline diastema, black triangle, and the gingival margin of the maxillary central incisor, while younger patients are more critical than older participants of midline diastema and black triangle. The findings are from a study published online August 13 in PLOS One.
Authors designed the study to compare patient perceptions of smile esthetics before and after orthodontic treatment and to compare those differences with respect to patient’s sex and age.
The study sample included 250 Spanish patients (166 women and 84 men; mean [standard deviation] age, 29.8 [11.7] years) undergoing orthodontic treatment with some kind of fixed appliance from January 2016 through May 2017. Authors divided patients into 3 groups: 15-25 years old, 26-39 years old, and 40 years and older. Mean treatment time was 16.9 months (12.3-24.1).
Authors obtained an intraoral photograph, then digitally altered the smile in 4 ways: a midline diastema that increased from o.5 millimeters to 2 mm in 0.5 mm increments, a black triangle between teeth nos. 8 and 9 that increased apically from 1 mm to 4 mm in 1 mm increments, gingival margin of the left central incisor (tooth no. 9) that increased from 0.5 mm to 2 mm in 0.5 mm increments relative to the maxillary right central incisor, and a gingival, or “gummy,” smile, that displaced the upper lip in 0.5 mm increments.
Authors asked patients to score the esthetics of each image before and after orthodontic treatment using a 10-point visual analog scale. A subgroup of 50 patients repeated the evaluation process 15 days later. Authors used Dahlberg d, t test, coefficient of variation, and interclass correlation to compare the assessments. Authors also used an analysis of variance model of repeated measures with sex and age variables to measure differences in evaluations according to the degree of alteration and group affiliation.
Midline diastema was the least acceptable anomaly. Patients reported a 79.2% reduction in esthetic acceptability compared with the control image. Authors noted statistically significant differences between sexes, in which women were more critical than men. The disatema was more acceptable to older than younger patients: older patients gave a 0.5 mm midline diastema a significantly higher score than younger patients (P = .028). Authors noted the same differences for 1 mm and 1.5 mm diastemas (P = .022 and P = .018, respectively).
Gummy smile was shown to be the most acceptably anomaly, with a reduction in scores of 4.5%. Patients who completed orthodontic treatment gave higher scores for gummy smile variations of 0.5 mm and 0.2 mm than those who had not started treatment.
The black triangle anomaly received the second lowest scores. Patients reported a 35.5% reduction in esthetic acceptability compared with the control image. Authors noted no statistically significant differences in patient evaluations between sexes before and after treatment, although men were found to be more tolerant than women of 3 mm (P < .001) and 4 mm (P = .096) black triangles. Patients younger than 40 years were much more critical of 2 mm images than older participants.
Gingival alterations to the margin of tooth no. 9 received a 19.6% reduction in score compared with the control group. Men awarded a higher score than women to a 1 mm change in the gingival margin (P = .063), although differences grew as the anomaly increased (P < .001).
Read the original study here or contact the ADA Library & Archives for assistance.
Advertisement

Glass ceramic color changes “clinically acceptable” after coffee thermocycling
Glazed or polished zirconia-reinforced lithium silicate (ZLS) and lithium disilicate (LDS) surface treatments produced clinically acceptable color changes after coffee thermocycling, and LDS was more translucent than ZLS. The findings are from a study published in the August issue of The Journal of Prosthetic Dentistry.
Authors designed the study to see how different surface treatments (glazing and polishing) and coffee thermocycling would affect the color and relative translucency of computer-aided design and computer-aided manufacturing (CAD-CAM) monolithic ZLS and LDS glass ceramics.
Authors divided 36 1.5-millimeter thick CAD-CAM glass-ceramics into 2 groups: 18 ZLS and 18 LDS. They then divided the ZLS and LDS groups into 2 groups each according to treatment received (glazing or polishing). Authors applied surface treatments to 1 side of the specimen and left the other side untreated.
Authors manually polished 9 specimens in the ZLS group with a slow-speed handpiece and the manufacturer’s 2-stage polishing assortment. Authors applied a thin layer of glazed material to 9 more specimens in the ZLS group and fired the specimens at 8000C for 60 seconds. Authors manually polished 9 specimens in the LDS group with a slow-speed handpiece and the manufacturer’s 3-stage polishing assortment. They applied a thin layer of glaze to 9 more specimens in the LDS group and fired the specimens at 770oC for 90 seconds.
All specimens were stored in distilled water at 370C for 24 hours before baseline spectral radiance measurements were obtained. Authors measured the spectral radiance on black, gray, and white backings using a noncontact spectroradiometer. Authors subjected all specimens to 5,000 thermocycles in a coffee solution, then cleaned them by brushing 10 times circumferentially with toothpaste under running water. Authors cleaned all specimens ultrasonically for 10 minutes and dried before obtaining measurements.
Authors measured color differences for all specimens before and after coffee thermocycling on the gray backing using the Commission on Illumination Delta Empfindung 2000 color difference formula. They used perceptibility and acceptability thresholds of 0.8 units and 1.8 units, respectively. Authors used an analysis of variance model to measure color difference and relative translucency values with the maximum likelihood estimation and Satterthwaite degrees of freedom methods. They used the Tukey-Kramer adjustment (α = .05) to resolve any significant interactions between surface subgroups.
Authors found that the type of material had a significant effect on color difference (P = .018). Material type (P < .001) and coffee thermocycling (P = .014) significantly affected the translucency of both materials. LDS had higher translucency than ZLS before and after coffee thermocycling. Authors found no significant differences between the translucency of glazed and polished ZLS surfaces before and after coffee thermocycling, but they found significant differences between glazed and polished LDS surfaces.
“Although all groups presented color changes that were clinically acceptable,” the authors noted, “glazing and polishing may be the finishing method of choice for zirconia-reinforced lithium silicate material, and glazing may be preferred for lithium disilicate.”
Read the original study here or contact the ADA Library & Archives for assistance.
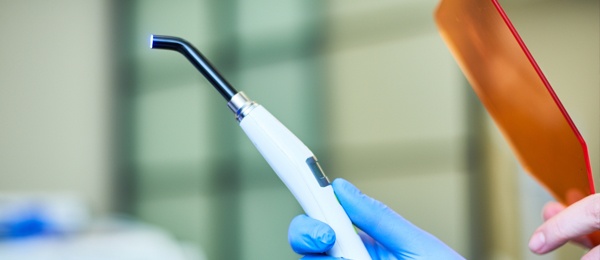
Curing unit brands, exposure times, affect polymerization of bulk-fill composites
More curing light exposure time increases the depth of cure (DoC) and degree of polymerization (DoP) of bulk-filled composites, but DoC and DoP remain unchanged beyond certain limits. High levels of DoC or DoP are not always associated with one another. The findings are from a study published in the October issue of Dental Materials.
Authors designed the study to measure how high-irradiance light-curing units (LCUs) affect the DoC and DoP of bulk-filled resin-based composites (RBCs). Authors used 3 light-emitting diode LCUs (FlashMax-P3, Paradigm, and SPEC3) to polymerize 5 bulk-fill RBCs and 1 nonbulk-fill RBC in different combinations. They used the International Organization for Standardization standard 4049 to define a nonbulk-fill or standard RBC as one with a DoC of 3 millimeters or less.
Authors categorized SPEC3 (3-second mode) and FlashMax-P3 as high irradiance LCUs (≥ 2,000 milliwatts per square centimeter) and SPEC3 (main mode) and Paradigm as conventional irradiance LCUs (< 2,000 mW/cm2). Using these 3 LCU brands and various curing combinations, authors calculated 6 radiant exposures (7.1, 9.0, 12.3, 21.4, 24.5, and 36.5 joules per square centimeter) from the combinations of irradiances and exposure times (2.378 × 3, 3.001 × 3, 1.226 × 10, 2.378 × 9, 1.226 × 20, and 1.827 × 20 J/cm2) respectively.
Exposure times were 3 or 9 seconds for FlashMax-P3 and 10 or 20 seconds for Paradigm, depending on which LCU brand was applied. Exposure times for the main and 3K modes of SPEC3 were 3 seconds and 20 seconds, respectively. Authors categorized exposure times as standard (20 seconds), short (9 or 10 seconds), and ultrashort (3 seconds).
Authors calculated irradiance by dividing the spectral radiant power (milliwatts per nanometer) as a function of wavelength (nm) over the whole range by the active area of the LCU tip. Light guide diameters were 0.72 cm, 0.78 cm, and 0.91 cm for SPEC3, FlashMax-P3, and Paradigm, respectively. Authors used a spectrophotometer to measure the irradiance of the 3 LCUs.
Authors used a Fourier transform infrared attenuated total reflection spectrometer to measure DoP per RBC at the bottom surface as a function of postcuring times for Paradigm, FlashMax-P3 and SPEC3. They analyzed data with nonlinear regression and analysis of variance/Tukey models.
Authors found significant differences (P < .05) in mean irradiances among all 3 LCU brands. The rankings from highest to lowest were SPEC3 (3-second mode, 3,001 ± 8 mW/cm2 ), FlashMax-P3 (2,378 ± 22 mW/cm2), SPEC3 (main mode, 1,827 ± 5 mW/cm2), and Paradigm (1,226 ± 0.3 mW/cm2). Authors also found significant differences in DoC and DoP among all bulk-fill RBCs when using the same radiant exposure.
“Clinicians should be familiar with the chosen LCU and its features and realize that each brand of [light-emitting diode] LED LCU is designed to be used differently,” the authors noted. “There is not a ‘one size fits all’ dental LCU available that one can operate the same way for all material types.”
Read the original study here or contact the ADA Library & Archives for assistance.

Biological, technical outcomes of single-implant crowns unaffected by submucosal veneer
Veneering the submucosal part of zirconia abutments does not significantly influence biological and technical outcomes in single-tooth implant sites up to 3 years, according to a study published in the September/October issue of The International Journal of Periodontics & Restorative Dentistry.
Researchers designed the study to measure whether the pink veneering ceramic of the submucosal part of zirconia abutments would influence biological and technical outcomes of all-ceramic single-implant reconstructions.
Twenty patients (mean age, 50.25 years [25.5-79.9]) received 1 single-tooth implant in the maxilla or mandible reconstructed with a customized zirconia abutment and a cemented single crown made of lithium disilicate. Authors randomly allocated patients into 2 groups: 10 patients who received a customized white zirconia abutment modified submucosally with pink veneering feldspathic ceramic (test group) and 10 patients who received a customized white nonveneered zirconia abutment (control group).
Authors extended veneering ceramic vertically 1 millimeter starting at the level of the crown margin, with a standardized thickness of 0.5 mm. The abutment shoulder was located 1 mm below the mucosal margin. Abutments were fixed onto the implants with a torque of 20 newton centimeters. Full-ceramic crowns were cemented onto the abutments.
Authors obtained radiographs on the day of implant placement, at baseline, and after 6 and 12 months. They performed a baseline examination 7 to 10 days after implant crown insertion and follow-up examinations at 6, 12, and 36 months. Authors recorded probing depth (PD), bleeding on probing (BoP), and plaque control record at 6 sites for every implant. They scored BoP and plaque control record as present (1) or absent (0). They measured the width of the keratinized mucosa/gingiva (KM) as the distance from the mucosal/gingival margin to the crown margin/cementoenamel junction at the buccal aspect of implants and teeth. They measured mucosal thickness 1 mm below the gingival margin at each implant.
Authors measured the distance between the bone crest and implant shoulder at the mesial and distal aspect of each implant. They calculated bone level changes between baseline and the 36-month follow-up. They measured mucosal/gingival recession at the midbuccal and midoral aspects of the implant and the respective contralateral tooth. Authors used the Wilcoxon-Mann-Whitney test to compare metric parameters between the 2 groups. They used the Wilcoxon signed rank test to compare paired data of implant and tooth values.
Eighteen patients were recalled at the 36-month follow-up. No implants were lost during the study period, resulting in a survival rate of 100% at the implant level and 95% at the restorative level. Two patients experienced minor chipping.
Authors found no significant differences between the groups regarding median probing depth, BoP, and papilla index values after 36 months. Mean (standard deviation [SD]) KM at the implant sites was 3.22 (1.20) mm (median, 3 mm) for the test group and 3.67 (1.00) mm (median, 4 mm) for the control group. Median values were statistically significant in favor of the control group (P = .037).
Mean (SD) mucosal thickness values were 1.60 (0.39) mm (median, 1.5 mm) at baseline and 2.61 (0.96) mm (median, 2.5 mm) after 36 months for the test group and 1.70 (0.48) mm (median, 1.75 mm) at baseline and 3.06 (0.81) mm (median, 3 mm) at 36 months for the control group.
Differences between groups were significant at the 36-month follow-up (P = .013). Values for mean (SD) marginal bone levels were –0.06 mm (0.62) mm (median, 0.06 mm) for the test group and 0.18 (0.52) mm (median, 0.13 mm) for the control group at baseline. Changes over time reached –0.27 mm (0.41) mm (median, –0.26 mm) for the test group and –0.21 (0.30) mm (median, –0.31 mm) for the control group. No statistical significance was reached within or between groups.
Read the original study here or contact the ADA Library & Archives for assistance.

Request a sample today!
Estelite Sigma Quick was awarded Dental Advisor’s Top Universal Composite Award for nine years in a row. Order a sample today, and experience why.

Full library. One price.  NEW! ADA CE Online subscriptions are here! Get unlimited access to the ADA CE online library, including JADA, for one year from purchase. Access anywhere, anytime. With new courses being added every month, you’ll never run out of education opportunities. Group subscriptions are also available, check it out now!
Advertisement

The consulting editor for JADA+ Scan — Cosmetic/Esthetic is Luiz Meirelles DDS, MS, PhD, DMD, FACP, Diplomate, American Board of Prosthodontics, Professor, University of California San Francisco. |
|
JADA+ Specialty Scans and JADA+ Scans Editorial and Advertising Policies All matters pertaining to advertising should be addressed to the advertising sales manager, Sales and Marketing Department, American Dental Association, Publishing Division, 211 E. Chicago Ave., Chicago, IL 60611, 1-312-440-2740, fax 1-312-440-2550. All advertising appearing in ADA publications must comply with official published standards of the American Dental Association, a copy of which is available on request. |
